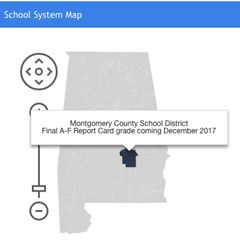
 Parents can now look up report cards for their child’s school on the Alabama State Department of Education (ALSDE) website. Just like a student’s report card, it’s not intended to identify which are good and which are bad – it’s meant to help identify the areas that schools and systems need to work on to improve.
The report cards have been in the making for years since legislation was first passed in 2012, and the ALSDE published in December a database with “Phase I” report cards.
This year’s report cards do not include the letter grades required by state law, but next year’s report cards will include more data points (once they become available) and are expected to assign letter grades.
School report cards, with or without letter grades, can serve as a conversation starter between a school and its community about what’s working and what’s not. They can help identify best practices, jumpstart more collaboration, and set schools on a path to a brighter future for students if stakeholders see them as a starting point for improvement and not a condemnation of schools and students.
Despite the lack of official letter grades, AL.com calculated letter grades for each school system based on available data and weights set by the ALSDE. Letter grades are based on the standard scale for A-F (100-90 is a an A, 89-80 is a B, etc.)
The results may surprise you.
Of the 137 school systems in Alabama, nearly half (46%) earned a B, which was also the average grade for Alabama. Just over one in ten systems (11.7%) earned an A. Nearly a third (30.7%) earned a C. Only 15 systems earned a D, and one earned an F.
Adding letter grades reveals some success, especially among school districts educating large percentages of low-income students.
Only one district that earned an A (Oxford City) has a majority of students who qualify for the federal Free Lunch program, a commonly accepted measure of poverty in a school district. However, of the districts that earned a B, 73% are majority low-income. Poverty certainly makes it more challenging for students to achieve academically, but the large number of “B systems” with a majority of low-income students indicates poverty does not have to be destiny — keeping the grand promise of public education.
What’s Oxford City doing differently? What about Pike County, which has the largest percentage of low-income students among B systems? There’s potentially much to learn here, and it’s worth taking a deeper look at what sets the A and B systems apart from the C, D and F systems.
Last year, the Public Affairs Research Council of Alabama (PARCA) identified programs in six systems in Alabama that were “Exceeding Expectations” in a report for the Business Education Alliance (BEA) [http://parcalabama.org/wp-content/uploads/2016/08/Exceeding-Expectations-Report.pdf]. (A+ consulted with BEA and PARCA on this report.) Of the six systems profiled in BEA and PARCA’s report, four are majority poverty systems that earned an A or B on AL.com’s letter grade report cards, including Oxford City and Pike County.
School System | Grade from AL.com | Percentage Low-Income |
| Oxford City | A | 58.4% |
| Muscle Shoals City | A | 32.9% |
| Pike County | B | 77.1% |
| Opp City | B | 56.6% |
| Blount County | B | 56.2% |
| Montgomery County | C | 55.6% |
The Exceeding Expectations report profiles programs helping students in each of these six systems, and it’s helping many students beat the odds. (Montgomery County was highlighted for an innovative summer learning program in the community helping elementary students.) Thanks to the clarity provided by school report cards, it’s easier to see that there are many more systems that also may be beating the odds.
Poverty does not have to be destiny, and as we look for ways to improve our schools, our neighbors may be the first place to turn to look for ideas.
How did your local school do? Take a look at the ALSDE database here, and see AL.com’s letter grades for each system here.

0 Comments on "What Can We Learn from the New School Report Cards?"